Our Quant Blue Chip Strategy
December 16, 2024 | Backtest: 2010–2024
This is a fully quantitative, rules-based approach designed for stability. The Quant Blue Chip Strategy employs contrarian signals, taking reversal bets on blue chip, dividend-paying stocks and optimizing for a high win rate. The strategy delivered 38% annualized return from 2010–2025 beating the S&P 500 with wide margin—achieving this outperformance with significantly lower volatility and smaller drawdowns, and producing only one negative year over 15+ years!
Performance Metrics:
| Average return per trade | 1.44% |
| Average hitrate | 71.0% |
| Years with positive return | 15 |
| Average return vs S&P | 0.42% |
| Years with negative return | 1 |
| Months with positive return | 134 |
| Months with negative return | 45 |
Risk Metrics:
| Sharpe Ratio | 1.091 |
| Sortino Ratio | 1.67 |
| Beta | 1.0002 |
| Standard Deviation | 1.24 |
| Max Drawdown | -10.2% |
Like what you see?
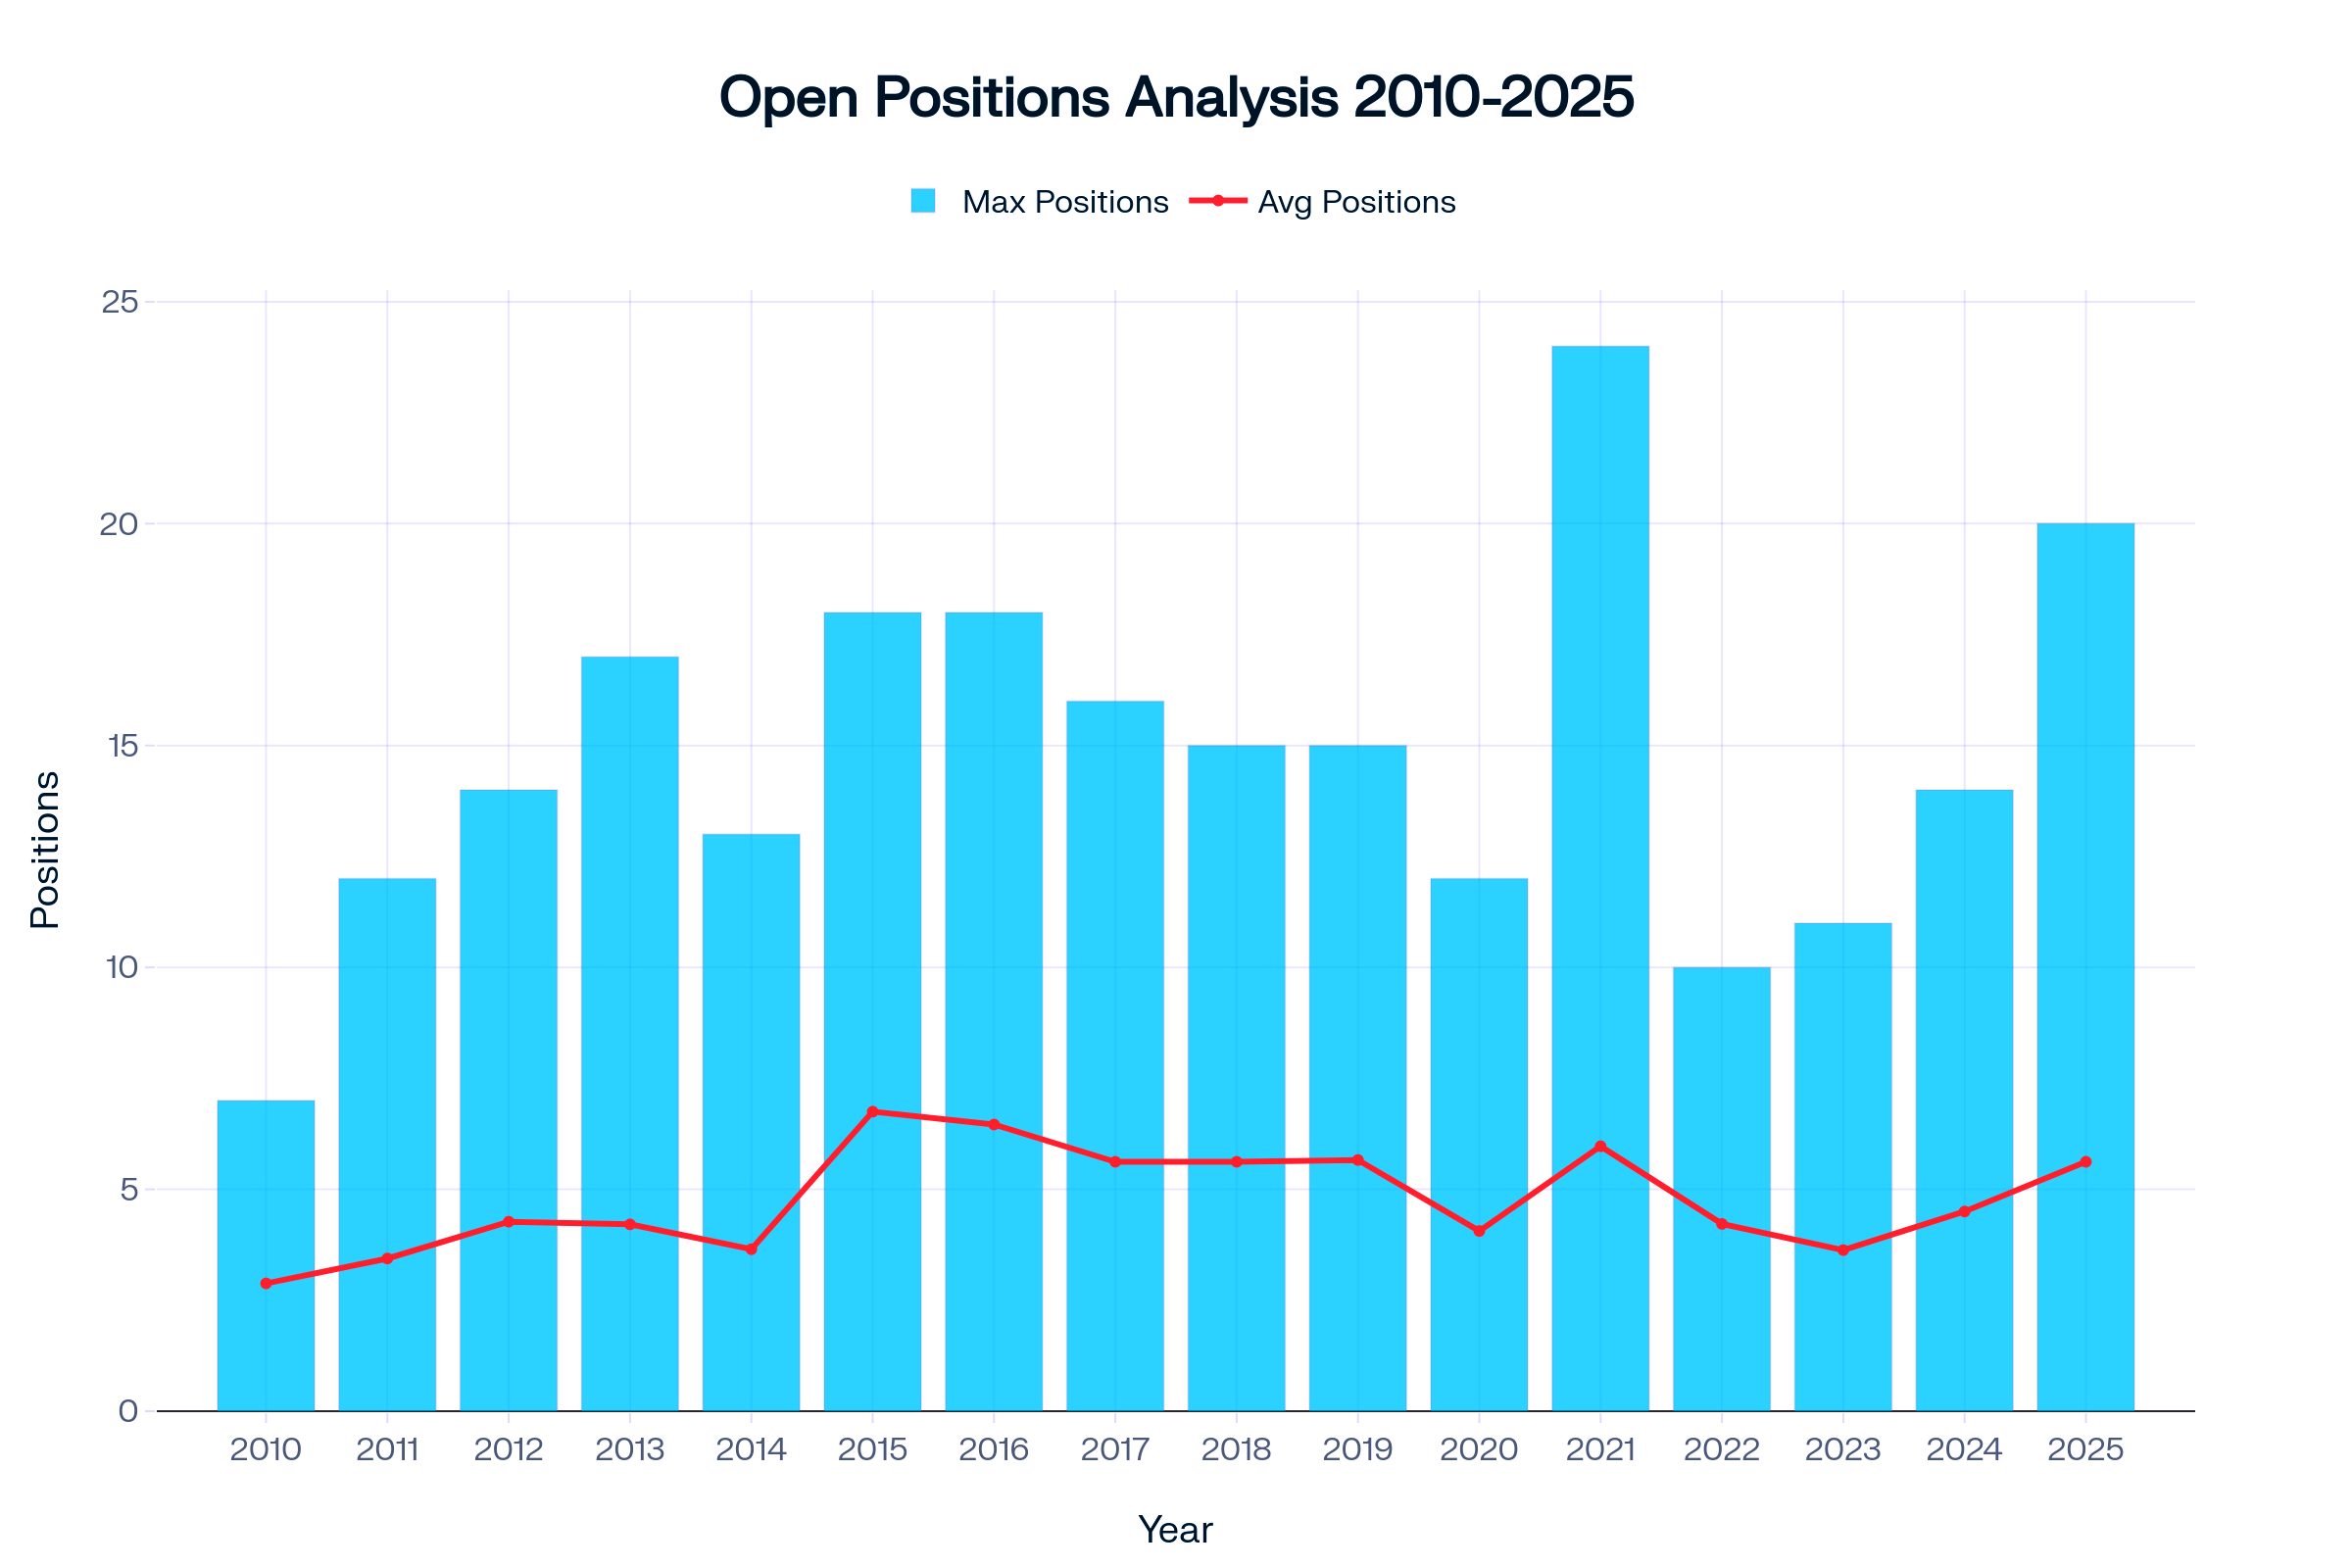
Total Capital Deployed:
| Average trades per month | 5.7 | Average days in a trade | 25 |
| Max open positions | 24 |
| Average open positions | 4.34 |
Unlock exclusive access to the "Quant Blue Chip Strategy:
Subscribe now to receive daily emails with precise open/close trade signals, up-to-date portfolio performance, and expert strategy insights—delivered each market day. Empower your investing with actionable, data-driven guidance proven to outperform the S&P 500. Join us to get institutional-quality signals in your inbox and take control of your financial future.
Why BeefySignals?
Our disciplined methodology—strategic asset allocation, proactive market adaptation, and rigorous model validation—drives consistent outperformance within the S&P 500 universe. You benefit from:
• Superior total returns vs. market benchmark
• Enhanced risk-adjusted performance (higher Sharpe & Sortino ratios)
• Clear transparency of all of our strategies' metrics
• Lower volatility and maximum drawdowns
• Higher win rates
Investments in the securities market are subject to market risks. Read all related documents carefully before investing. The data provided here is for informational purposes only and is not intended for trading purposes or as financial advice. Past performance is not indicative of future results.